Configure the Sensor and Datalogger
Introduction
Setup Sensor Configuration
Requires administration privileges.
Sensor Configuration is the first step of initializing the NetMeter-OMNI-8C.
Basic Setup
There are a minimum set of 5 items to be configured. Everything else is optional:
- Set the time clock
- Enter a Sensor Label
- Enter a Sensor Description
- Set the datalog period
- Configure some inputs
Make sure you press Save Configuration to store the configuration changes.
After saving the configuration, the NetMeter will immediately begin recording data at the specified period.
Timeclock Battery
If "Battery Good" is not displayed, then the real-time clock battery should be replaced. See the Installation Manual for battery replacement instructions.
Sensor Timeclock
Click Set Sensor Clock to Browser Time to set the NetMeter timeclock. This relies on the accuracy of the timeclock of the computer you are using to do this set up.
Make sure that your PC is set up for timeclock synchronization to an accurate reference source (further information here).
Sensor Label
This should be a brief mnemonic to identify the NetMeter-OMNI. Must be an alphanumeric text string up to 46 characters. Do not use special characters.
Examples:
- Flow-Sensors-East
- Extruder-5
- Chiller-1
Sensor Description
This should be a more descriptive way of identifying the NetMeter-OMNI. Must be a text string up to 46 characters. Do not use special characters.
Examples:
- Basement Utilities Room
- West Wing Shop Air
- Toronto Office Utilities
Currency Units
Select the units to be used for currency. Choose a preset or enter a custom value.
Main DataLog
Auto Enable Storage
Set the "Auto Enable Storage" checkbox to "on" (active checkmark) to ensure that data will be recorded into the data logger.
Main Log Period
Select a specific time "Period" for data storage. Shorter log update periods will result in shorter storage durations. A value of 1m will normally provide approximately 1 year or more of storage.
Data is always recorded on the exact period boundary. For example, if a period of 1 minute is chosen, data will be recorded on the 1 minute boundary.
Input Configuration
Understanding the Input Functionality
The functional model of each input is depicted below:
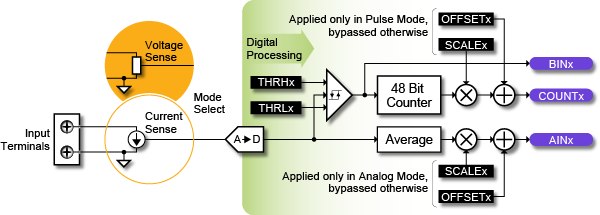
Functionality of each Input Channel of the NetMeter-OMNI
Referring to the diagram above:
- The physical inputs can be configured for either Current mode or Voltage mode
- An analog to digital converter (A->D) converts the current/voltage to a digital value
- When the Analog Function is chosen (AINx), the A->D output is averaged over multiple samples, multiplied by a scale factor (SCALEx), then has an offset added (OFFSETx) to produce the value that is displayed.
- In Pulse or Binary mode, a threshold detector is used to convert the output of the A->D converter to a binary (1/0) value. When the binary value transitions from 0->1 or 1->0 (depending on the polarity setting) the counter is incremented. A user-defined scale (SCALEx) and offset (OFFSETx) is applied to the counter value to generate the final result for display.
How Analog Data is Sampled: Any "instantaneous" Analog value is actualy an average of 200 samples. This helps to reduce noise.
When data is stored into the datalogger, even more data is averaged. For example, Analog data that is logged every 1 minute will be the average of 60 "instantaneous" values (one per second). That is, each datalogged value is an average of 60 x 200 samples (12,000). As a result, sensors that are noisy or measuring rapidly fluctuating signals will be captured as a high sample rate average over the full log interval.
Each of the 8 inputs can be configured from the SetupSensor Configuration webpage. The configuration defaults for channel 0 are shown in the Figure below. The same options are available for all channels.
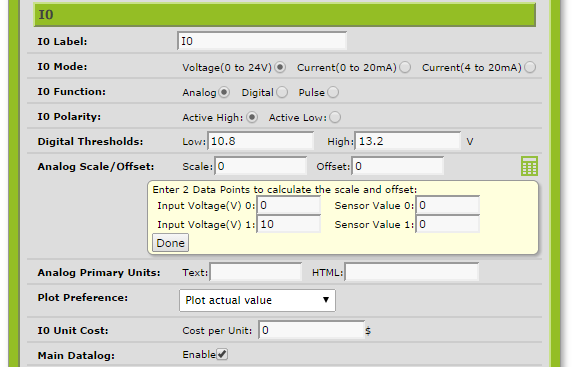
Input Configuration for a Single Input Channel Showing the Default Settings
Input Configuration Settings
The configuration fields are:
- Label: This is the way the input will be named in any graphs or reports produced. The Label for each channel should be unique and clear.
- Mode: This is the physical input configuration – either voltage (0-24V), current (0-20mA), current (4-20mA), or Modbus.
- Function: This is how the incoming physical signal will be processed for display and logging:
- Analog: the incoming voltage or current will be scaled and then displayed as an analog value. This is used with transducers for values such as temperature, pressure, etc.
- Digital: this input will be used to detect a logical state (on/off).
- Pulse: this input will be used to count pulses.
- Polarity: Used for Pulse/Digital input mode.
- Active High: Pulse counter is incremented when the voltage/current transitions from low-to-high.
- Active Low: Pulse counter is incremented on high-to-low transitions.
- Digital Thresholds: Sets the voltage/current corresponding to an on/off (High/Low) state. A voltage/current less than ‘Low’ defines a low (0) input. A voltage/current greater than ‘High’ defines a high (1) input. The value of the High Threshold should always be higher than the low Threshold value. The gap between the low and high Thresholds is the hysteresis.
- Analog/Pulse Scale and Offset: Set the scale factor and offset for the Input function. The reported value is the raw value multiplied by ‘Scale’ and then added to ‘Offset’. In mathematical terms: the final value y = m*x + b where m is the scale factor applied to x (the original value) and b is the offset.
- The calculator icon (
 ) may be clicked to reveal the helper widget shown in screen shot above ("Enter 2 Data Points to calculate the scale and offset"). The widget allows the scale factor and offset to be calculated from 2 data points. Enter the data for the 2 points and then press Done to close the widget.
 - Analog/Pulse Primary Units: These are the units of measure for the input function chosen. There are 2 types available: Text and HTML. Text is the units in standard ASCII text with no interpretation while HTML may include special character sequences displayed as HTML markup (see HTML Formatted Units). Leaving the HTML field blank will revert to the Text field being displayed.
- Plot Preference: Controls the default for the data display on some screens.
There are 5 options: - Plot actual value: This is the default mode where data is displayed as the actual value of current/voltage/pulse count after it has had the scale and offset applied. This is typically used for everything except the pulse count mode.
- Plot as units per second: This and the following three modes are designed to allow cumulative pulse count values to be converted to a flow rate for display. In this case, a cumulative quantity such as cubic feet or cubic meters can be converted to a flow rate in ft³/s or M³/s. The flow rate at time t is defined as:
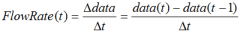
Where is the change in the data value between 2 successive samples and
  is the time interval between the 2 samples.
For example: if the counter shows 1030L of water at time t and 1000L of water 1 minute prior, we have a flow rate of 30L per minute or 0.5L per second flow rate. - Plot as units per minute: Same as above except the flow rate is converted to units per minute.
- Plot as units per hour: Same as above except the flow rate is converted to units per hour.
- Plot as units per day: Same as above except the flow rate is converted to units per day.
- Secondary Units: This option is available when a plot preference other than ‘Plot actual value’ is chosen. These are the units of measure for the input function when a rate is displayed rather than an absolute value. As in the case of the Primary Units, both Text and HTML versions of the units may be entered. Suppose that gas is being measured in the primary units of cubic feet. This could be entered as ‘CF’ for the primary text units and ‘CFM’ for the secondary text units (‘Plot as units per minute’ should be selected for the Plot Preference). This will allow cumulative values of gas to be displayed with the units ‘CF’ and the cubic feet per minute flow rate to be displayed with the units ‘CFM’.
- Unit Cost: Where applicable, a cost per unit may be entered. Examples of this might be the cost per liter of water or per cubic foot of gas. Leave this field blank for quantities where cost is not applicable (i.e. for temperature measurements).
- Main Datalog: When this option is enabled, the data values from the selected functions will be stored in the data log. When disabled, data for this channel will not be stored. In order to maximize memory usage, unused channels should be disabled.
One consequence of displaying pulse channels as a flow rate may be that, at low pulse rates, the data may look very "stepped" or "quantized" rather than smooth, especially at short time scales (hours or minutes). That is an artifact of the slow pulse rate. However, over many hours or days there are enough pulses to produce a smooth curve.
Input Configuration: Modbus Mode
Note: Firmware build 0452 or higher is required to use the Modbus Client feature.
When Modbus input configuration mode is selected, data for this channel will be captured via Modbus TCP. In this mode, the NetMeter-OMNI acts as a Modbus Client device. It queries the specified external Modbus Server device every second (user selectable) in order to maintain a copy, inside the NetMeter-OMNI, of the realtime data from the Modbus Server device.
If a Modbus query fails, the channel will not be updated during that polling cycle. This will be seen as a "stuck" sensor where the value doesn't change for the period of communication loss.
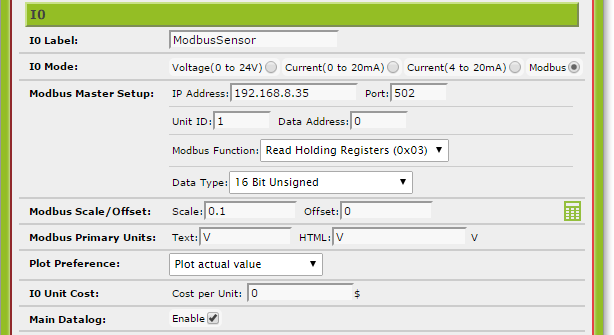
The following parameters control the Modbus Client operation:
- IP Address: The IPV4 network address of the Modbus device
- Port: The network port number of the of the Modbus device. The standard Modbus port number is 502. However, this may be set according to the requirements of the Modbus Device.
- Unit ID: The Modbus unit identifier of the specific device to be polled. This is sometimes referred to as the "slave address" or "unit number". It should be a value between 0 and 255.
- Data Address: The address of the specific Modbus register to be captured. The Data Address range starts at 0. The "Data Element" should not be used here. For example, a Data Element of 40001 is equivalent to a data address of 0 and a Modbus Function of "Read Input Registers" (Function 4) this would be configured in the NetMeter-OMNI as Data Address:0 and Modbus Function:4
- Modbus Function: The Modbus function code to be used for the query. This is either Read Holding Registers (0x03) or Read Input Registers (0x04).
- Data Type: Configures how the Modbus Register(s) are to be interpreted. In the case of 32 bit registers, they are captured as 2 consecutive 16 bit registers. The data type setting for the NetMeter-OMNI should match the data type defined for the sensor. The options are:
- 16 Bit Unsigned
- 16 Bit Signed
- 32 Bit Unsigned, Little Endian
- 32 Bit Signed, Little Endian
- 32 Bit Float, Little Endian
- 32 Bit Unsigned, Big Endian
- 32 Bit Signed, Big Endian
- 32 Bit Float, Big Endian
In addition to setting the parameters in the Sensor Configuration page, the Modbus Master feature needs to be enabled. This is configured in the SetupModbus page.
See also the Modbus help page.
Input Configuration Examples
The scale factor and offset for each input should be set such that, depending on the chosen function, the analog voltage/current or pulse counter value is converted into the desired units. There are 2 main sensor types to consider:
- Analog sensors (either voltage mode or current loop)
- Pulse sensors
Analog Sensor Example
A simple example will help illustrate the Scale/Offset settings for an analog input:
Suppose you have a current loop temperature sensor with the following characteristics:
- 4mA at 0°C
- 20mA at 1000°C
Set the "Mode" of the input to Current(4 to 20mA) and "Function" to Analog. For this function, the "Polarity" and "Digital Thresholds" are not applicable.
The way that the 4 to 20mA sensor current is converted to a temperature value is by multiplying the current value by a Scale factor and then adding an Offset value. The Scale and Offset values may be calculated as:
| Scale (°C per mA) = | 1000°C - 0°C | = 62.5°C per mA |
| 20mA-4mA |
Offset (°C) = - 4mA * 62.5°C per mA = -250°C
This same calculation may also be done more easily using the built-in widget (click on the calculator icon ). This is illustrated below:
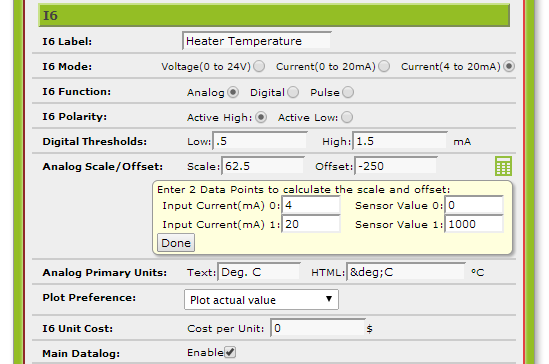
Example Configuration for a 4-20mA Temperature Probe
The 2 known data points for the sensor are entered into the widget as shown above and then the Done button is pressed to complete the operation. The Scale and Offset have been properly set.
Next, set the "Analog Primary Units" as shown above. The "Text" units will be used in plain text reports and the "HTML" units will be used in web pages so that special symbols such as ° can be displayed. The HTML tag "°" accomplishes this. See below for more information about HTML units.
Pulse Sensor Example
Consider a pulse output gas meter with the following specifications:
- KY pulse that will use the Backup Power feature
- 1 pulse = 0.2 cubic feet
- Units of measure to be Cubic Feet (cumulative) and Cubic Feet per Minute for rate display
Here is a typical configuration for this type of input:
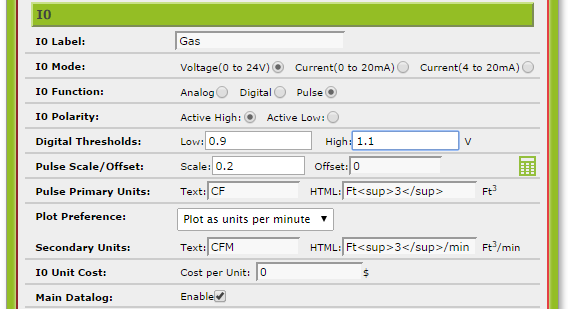
Example Gas Meter Configuration
HTML Formatted Units
In many on-screen displays, the units of measure are taken using the HTML version of the defined units. If not defined, the Text units are shown instead.
The use of HTML for units display has the advantage of being able to display special characters such as italics, subscripts, superscripting and the like. Here are some examples:
| Text Units (as entered and displayed) |
HTML (as entered) |
HTML (as displayed) |
|---|---|---|
| CFM | Ft.<sup>3</sup>/m | Ft.3/m |
| CFM | Ft.³/m | Ft.3/m |
| Deg. C | °C | °C |
The first example above uses the superscript tag: <sup></sup>. In the second example, the superscript 3 is generated using the special HTML tag ³ and is an alternate to using <sup>3</sup>.
The third example uses the HTML tag for the degree symbol (°):°
Here are some examples of tags that may be useful:
| Tag | Description | Displayed As |
|---|---|---|
| ¢ | cent | ¢ |
| £ | pound | £ |
| ¥ | yen | ¥ |
| ° | degree | ° |
| ± | plus-or-minus | ± |
| ² | superscript two - squared | ² |
| ³ | superscript three - cubed | ³ |
| µ | micro | µ |
A complete list of special HTML codes may be found at http://www.ascii.cl/htmlcodes.htm